 While veterinarians tend to agree that their profession faces a variety of economic and workforce challenges, disagreements about data can muddle the discussion.
That was the case when The New York Times reported in February 2013 gloomy job and financial prospects for the profession. Leaders in academia and professional organizations tended to respond by criticizing the data used in the story rather than addressing the issues it raised.
One example: The Times story gave the average starting salary for veterinarians as $45,575 in 2012. While the article cited American Veterinary Medical Association data accurately, it didn’t make clear that the figure averages the starting salaries for private-practice jobs, which run around $65,000, with those of internships, which pay around $30,000.
Cases of missing context and data discrepancies continue to pop up.
Take the number of veterinarians in the workforce. Even that basic figure is elusive. Three different figures come from three reputable sources: the U.S. Bureau of Labor Statistics (BLS) Occupational Outlook Handbook, the AVMA website and a 2013 workforce study commissioned by AVMA. Each study uses a different estimation method.
Another inconsistency related to the population of veterinarians arose during the AVMA Veterinary Economics Summit in October. AVMA economist Michael Dicks reported the number of U.S. graduates of veterinary colleges in 2014 totaled fewer than 3,000, while Lisa Greenhill, a researcher and official with the Association of American Veterinary Medical Colleges (AAVMC), tallied more than 4,000 graduates.
So who's correct? Both, as it turns out. Dicks was reporting only 2014 graduates of U.S. veterinary colleges while Greenhill gave the number of Americans who graduated that year from U.S. accredited veterinary programs worldwide.
The VIN News Service researched a collection of divergent statistics that have been presented over the years to characterize the profession's economic prospects, from trends in salaries and employment to educational debt and veterinary-college enrollment. In delving into the contexts and explanations for the inconsistent figures, the VIN News Service found that in most cases, discrepancies arise because of one of two reasons:
- The figures differ because they are based on the results of distinct studies that yielded different results.
- The figures come from the same source but are counting different things.
The examples below illustrate how existing data on the veterinary economy can be used to tell quite different stories about the profession’s prospects. When the reasons for the disparities are understood, the cases exemplify how statements that seem to be contradictory can, in fact, be consistent.
Coming up with full explanations often is difficult because the sources of figures can be elusive. Raw data from AVMA studies such as the annual graduation survey generally are not made available to the public. Some figures are buried in federal databases, while others are available only in expensive reports produced by trade groups and AVMA. Increasing the accessibility of the information in these studies — the numbers themselves as well as detailed information on methodology and analysis — would help to resolve data-driven disputes within the profession.
Job placement
“Last year, 39 percent of graduates had no job offers …” — New York Times, Feb. 23, 2013.
“… data from our latest research, conducted several months following graduation, show that 98.4 percent of 2011 U.S. graduates and 97.7 percent of 2012 graduates report being employed in veterinary medicine at least six months after graduation.” — AAVMC, Feb. 26, 2013.
Both of these statements are true. The figures differ because the surveys on which they are based were conducted during different times. The first figure comes from AVMA’s annual survey of graduates, which is conducted in the month prior to graduation, while the second figure comes from a survey conducted by the AAVMC roughly eight months after graduation.
Nearly four decades of workforce analyses
Researchers, economists and academics have been studying the U.S. veterinary workforce since the 1970s. Last year, economist Michael Dicks, Ph.D., reviewed the literature for a paper titled "A short history of veterinary workforce analyses." Dicks, director of the American Veterinary Medical Association Economics Division, stated, “Throughout the literature on the supply and demand for veterinarians and veterinary services, excess capacity has been identified as chronic, persistent and in lockstep with the changing demand for veterinary services.”
Some materials he reviewed:
Summary of U.S. veterinary medical manpower needs, 1978-1990. J Am Vet Med Assoc. 1978 Aug 15; 173 (4): 369-372.
Takeaway: Supply and demand for veterinarians in private practice is in balance, but a surplus of 8,300 is projected by 1990. A shortage of veterinarians exists in industry.
National Research Council. Specialized Veterinary Manpower Needs Through 1990. National Academy Press, Washington, D.C., 1982.
Takeaway: The market in private practice is in balance; other sectors are uncertain.
Wise JK, Kushman JE. Synopsis of U.S. veterinary medical manpower study: demand and supply from 1980 to 2000. J Am Vet Med Assoc. 1985 Aug 15; 187 (4): 358-61.
Takeaway: Overall, veterinary services are at 24 percent overcapacity in 1980 and projected at 29 percent overcapacity by 2000. Real incomes for private practitioners are likely to fall 25 percent from 1980 to 2000.
Getz M. Veterinary Medicine in Economic Transition. Iowa State UP; 1997.
Takeaway: “The market for veterinarians is already saturated. The supply of licensed practitioners has grown much faster than the demand for the last two decades, to the point that career prospects are poor, relative to other professions.”
Brown, JP, Silverman JD. The current and future market for veterinarians and veterinary medical services in the United States. J Am Vet Med Assoc. 1999 Jul 15; 215 (2): 161-83.
Takeaway: Veterinary incomes are low relative to educational investment due to excess capacity and possibly poor pricing practices. Incomes are likely to stagnate during the next decade. The excess-capacity problem may improve if numbers of veterinary school graduates do not grow. Many private practices are inefficient; veterinarians tend to lack marketing and business skills. Modest potential exists for increased employment opportunities in government, industry public health and research.
Cron WL, Slocum JV Jr, Goodnight DB, Volk JO. Executive summary of the Brakke management and behavior study. J Am Vet Med Assoc. 2000 Aug 1; 217 (3): 332-8.
Takeaway: Low incomes are largely attributable to poor practice management and underpricing. Women and men substantially differ in reported satisfaction with a given level of income; women are satisfied earning less.
Wagner GG, Brown CC. Global veterinary leadership. Vet Clin North Am Food Anim Pract. 2002 Nov;18 (3): 389-99.
Takeaway: Need is growing for food animal veterinarians with interdisciplinary training and international perspective to address global infectious-disease issues.
Radostits O. Food animal veterinarians: an endangered species? Kansas State University conference. 2002.
Takeaway: Fewer veterinary students are choosing food animal medicine for a variety of reasons.
Riddle C, Mainzer H, Julian M. Training the veterinary public health workforce: a review of educational opportunities in US veterinary schools. J Vet Med Educ. 2004 Summer; 31 (2):161-7.
Takeaway: U.S. veterinary schools are responding to the need for training in public health, epidemiology and preventive medicine.
Gwinner KP, Prince JB, Andrus DM. Attracting students into careers in food supply veterinary medicine. J Am Vet Med Assoc. 2006 Jun 1; 228 (11): 1693-704.
Takeaway: Report provides recommendations to increase the supply of veterinary students interested in careers in food supply veterinary medicine.
Andrus DM. Gwinner KP, Prince JB. Job satisfaction, changes in occupational area and a commitment to a career in food supply veterinary medicine. J Am Vet Med Assoc. 2006 Jun 15; 228 (12): 1884-93.
Takeaway: Most food animal veterinarians are satisfied, proud and enthusiastic about their careers. That information should be shared with students.
Sterner KE. An invited perspective on the shortage of veterinarians in food supply veterinary medicine. J Am Vet Med Assoc. 2006 Jul 1; 229 (1): 30-2.
Takeaway: Decreased demand for food animal services is not the looming problem that some have feared.
Prince JB, Andrus DM, Gwinner, KP. Future demand, problem shortages and strategies for creating a better future in food supply veterinary medicine. J Am Vet Med Assoc. 2006 Jul 1; 229 (1): 57-69.
Takeaway: A critical shortage exists of veterinarians in food-safety and supply sectors.
Chaddock HM. Veterinarians: integral partners in public health. Paper to Congress regarding the Veterinary Workforce Expansion Act. 2007.
Takeaway: A shortage exists of more than 1,500 veterinarians in public health and is projected to reach 15,000 by 2020. This paper is followed by many calls to expand training and recruitment of veterinarians to meet this need.
Hird, DW. Global thinking and global education: philosophy, programs, perspectives. Prev Vet Med. 2009 Dec 1; 92 (4): 296-300.
Takeaway: There’s a strong justification for increased emphasis on global medicine for veterinarians.
Hernandez JA, Krueger TM, Robertson SA, et al. Education of Global Veterinarians. Prev Vet Med. 2009 Dec 1; 92 (4): 275-83.
Takeaway: Increased emphasis in global medicine for veterinarians is needed. Schools and colleges should be developing educational initiatives and opportunities in this field.
Government Accountability Office. Veterinarian Workforce: Actions Are Needed to Ensure Sufficient Capacity for Protecting Public and Animal Health. 2009.
Takeaway: Officials from federal and state agencies involved in four recent zoonotic disease outbreaks cited insufficient veterinarian capacity as a workforce challenge. However, 10 of 17 agencies interviewed had not assessed their own veterinarian workforce's response to outbreaks.
Jarman DW, Liang JL, Luce RR. Veterinary public health capacity in the United States: opportunities for improvement. Public Health Rep. 2011 Nov-Dec; 126 (6): 868-874.
Takeaway: Difficulties in recruiting and retaining veterinarians at the U.S. Centers for Disease Control and Prevention is caused by lack of awareness among veterinarians of opportunities in public health, non-competitive salaries and a need for more and better training.
Bureau of Labor Statistics. Occupational Outlook Handbook. 2012.
Takeaway: Projects employment of veterinarians to grow 36 percent from 2010 to 2020. “Job opportunities should be particularly good in government and in farm animal care.”
National Research Council. Workforce needs in veterinary medicine. Washington, D.C. National Academies Press. 2013.
Takeaway: Veterinarian shortages do not exist apart from industry. Enrollment is rising in veterinary colleges, where most students train for companion animal practice. Demand in that sector, however, is uncertain. Colleges should improve research capabilities and train more DVM-Ph.D.s
Getz, M. Education and earnings in health professions. J Vet Med Educ. 2012 Fall; 39 (3): 247-56.
Takeaway: Veterinarians earn less money than human health care professionals at all levels of education. Establishing new educational tiers (such as a nurse practitioner equivalent) may make more efficient use of education dollars.
2013 U.S. Veterinary Workforce Study: Modeling Capacity Utilization. The Center for Health Workforce Studies, School of Public Health, University of Albany-State University of New York.
Takeaway: Workforce study finds an existing excess capacity of roughly 12 percent.
Apparently, most new veterinarians who did not have job offers at the time of graduation were able to find employment within the next several months.
At the same time, getting a job out of veterinary college does appear to have become more difficult in recent years. From 2000 through 2007, the fraction of students who had accepted a job at the time of graduation consistently was between 75 and 80 percent, according to data from the AVMA's senior surveys. That figure dropped to 64 percent in 2009 and further fell to 53 percent in 2012. It rebounded to 69 percent in 2013.
The AVMA surveys also show a major shift in the type of job accepted by the time of graduation. In 2000, 58 percent of survey respondents had taken private-practice positions by graduation day, while 18 percent had accepted internships and residencies. In 2013, the latest year for which figures are available, only 37 percent of survey respondents had taken private-practice positions, while 30 percent had accepted an internship or residency. Of the remaining respondents, 2 percent had accepted a corporate or government job, while 31 percent did not have a job (because they had no offers, had not accepted an offer or were not looking for work).
In recent years, the response rate for the AVMA senior survey has exceeded 90 percent, meaning the results are probably representative of the group. Data for the class of 2014 are scheduled to be published in March, according to the AVMA.
In response to the worrying results of the AVMA survey of graduates in 2011 and 2012, AAVMC conducted follow-up surveys in February 2012 and 2013. In both cases, the AAVMC found that about 98 percent of respondents were employed in veterinary medicine. These surveys had response rates of 70 percent in 2012 and 67 percent in 2013. It is possible that unemployed recent graduates were less likely to respond to the survey, therefore biasing the results, but there is no way to know if this is the case.
The AAVMC data suggest the employment picture for new veterinary college graduates is not so bad and is substantially brighter than it is for another group of professional-school alumni who have been struggling economically — recent law school graduates.
Nine months post graduation, 11 percent of the members of the 2013 law-school class were unemployed and looking for work, while another 6.3 percent had taken jobs outside of the legal field, according to figures from the National Association for Law Placement.
Nationally, average unemployment in 2013 for all people with doctoral or professional degrees was 2.2 to 2.3 percent, according to the BLS. The unemployment rate for veterinarians (all veterinarians, not just recent graduates) is even lower: 1.8 percent in 2014, according to BLS figures. The BLS defines an unemployed person as someone who at any given time does not have a full- or part-time job, is able to work and is actively seeking employment.
Salaries
“Consider the plight of veterinarians. The average tuition and expenses for a veterinary degree at a private school has doubled in the last 10 years to over $200,000, well above the typical cost of law school. Yet their pay remains moribund at an average of $66,469 — much less than lawyers” — New York Times, Sept. 24, 2012.
“The average income for veterinarians in private practice … is $121,000, according to the American Veterinary Medical Association, an advocacy group for vets (citing figures from 2009…)” — New York Times, Nov. 2, 2012.
“... Starting salaries have sunk by about 13 percent during the same 10-year period (2001 to 2011), in inflation-adjusted terms” — New York Times, Feb. 24, 2013.
“The starting salaries of graduating veterinarians and veterinary medical salaries in general have been increasing at a rate greater than inflation, except for a slight dip in 2011” — AAVMC, 2011.
With context, the hodgepodge of salary figures in these examples can make sense.
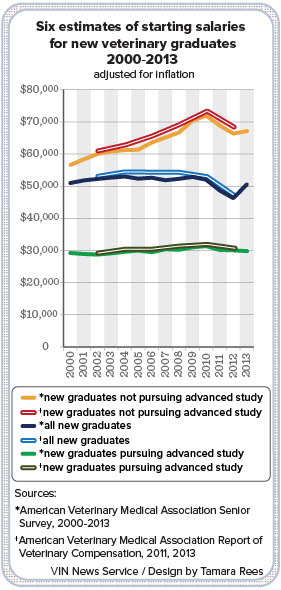
The first figure, $66,469, cites the average starting salary for the veterinarians in the class of 2011 who took jobs in private practice (and accepted a job by graduation and responded to the AVMA senior survey).
The second figure, $121,000, is the average income for all veterinarians in private practice in 2009, including owners and associates. That calculation is based on survey data from 2,196 private practice veterinarians who responded that year to the biennial AVMA Report on Veterinary Compensation. It is worth noting that the median salary reported in that study — $97,000 — is much lower than the average, suggesting a skewed data distribution in which the average is elevated by a relatively small number of very high salaries. What’s more, since the biennial salary survey has a low response rate of around 20 percent, there is the potential for response bias. For instance, veterinarians with higher salaries may have been more likely to complete the survey.
The third and fourth examples appear to contradict one another, but that’s because they’re counting different things. The 13 percent drop over 10 years reported in the Times article is calculated from data on the average starting salaries for all veterinarians who had jobs at the time of graduation, including those who took advanced study positions, which pay much less than private practice jobs. During the past decade, as discussed above, the ratio of advanced study jobs to private practice jobs has increased dramatically (again, considering only new graduates that had accepted jobs at the time of graduation). So, the average starting salary figure for all veterinarians has fallen even though starting private practice salaries have been rising. AVMA data show that starting private practice salaries for those graduates with jobs at the time of graduation grew 10 percent from 2003 to 2013 after adjusting for inflation, as the AAVMC statement indicates.
For all practice owners and associates, AVMA data show that average salaries fell in 2011, dropping below 2007 levels. Despite this decline, average salaries have increased substantially since the turn of the millenium. Averaged across all veterinarians in private practice, real annual salaries for associates increased 26 percent from 1999 to 2011, while real salaries for practice owners increased 15 percent. For comparison, average salaries for all U.S. wage earners with a graduate degree were about 2 percent lower in 2013 than in 2002, after adjusting for inflation. It’s unclear whether veterinary salaries have rebounded along with the general resurgence of the U.S. economy in the past several years. The 2011 salary data, published by AVMA in 2013, are the most recent available; data from 2013 are expected to be released in 2015.
New graduates increasingly are pursuing internships, and it is difficult to calculate the financial and intangible results of the training. Overall, the lower salaries that interns earn depress average starting salary figures for new graduates overall. Intangible benefits may accrue from increased clinical experience and confidence; however, doing an internship alone has not been shown to increase further earnings.
Advanced clinical training reaps higher earnings for only a minority of those who pursue it. The ones who make more money are those who achieve board certification in a clinical specialty, which requires being accepted to and completing a two- to five-year residency program and passing a rigorous examination.
In 2011, for instance, the median salary for board-certified specialists was $148,000, compared with $88,000 for non-specialists, according to AVMA data. Documents from the American Association of Veterinary Clinicians' Veterinary Internship and Residency Matching Program show that during the past three years, roughly 900 veterinarians (primarily new graduates) accepted lower wages to pursue an internship.
During the same time period, roughly 300 veterinarians a year were accepted into residency training programs. Whether they completed the residency and achieved board certification is unknown.
Student debt
“The average student debt for the 89.2 percent of veterinary students (in the class of 2012) who reported that they expected to have debt at the time of their graduation was $151,672” — AVMA news release, Sept. 26, 2012.
“Mean debt: $135,289.29” (for 2012 veterinary college graduates) — Presentation by economist Michael Dicks during the the AVMA Economic Summit, Oct. 29, 2014.
Information on student debt comes from AVMA’s annual survey of graduating veterinary students. Figures on average student loan indebtedness commonly are presented in two ways: the average debt for those students who borrowed money for school and the average debt for all students, including those who are debt-free. Roughly 10 percent of students reportedly do not rely on financial aid to pay for school.
In 2013, the latest year for which figures are available, educational debt for aspiring veterinarians with student loans averaged $162,113. That figure dropped to $146,226 when including debt-free veterinary students in the calculation. 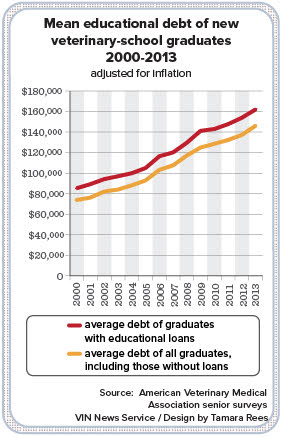
Tuition and fees at U.S. veterinary colleges vary widely — from $16,546 to $63,291 for the 2013-14 academic year — and so do debt burdens. In the class of 2013, about 29 percent of students with debt owed more than $200,000, while about 17 percent owed less than $100,000.
The debt and tuition figures relate to students at U.S.-based colleges; they do not include students at the international schools, a population that accounts for roughly a quarter of all U.S. residents enrolled in a veterinary institution. Tuition and fees at foreign programs are higher, on average, than in the United States.
No matter how the data are reported, it is clear that average veterinary student debt has grown dramatically in recent years. From 2000 to 2013, average veterinary student debt increased 90 percent when adjusted for inflation. That's counting only students with debt. The average student debt jumped 98 percent when factoring all students, including those without student loan debt.
Salaries for new graduates in private practices grew during the same period but by much less — 19 percent.
Women, who now make up nearly 80 percent of all veterinary college graduates, average heavier debt burdens and lower starting salaries than their male counterparts. For the class of 2013, women with debt owed an average of $164,650, while the average starting salary for all female veterinarians (excluding those entering advanced study) was $65,968. For men, the corresponding figures were $153,295 and $70,008.
Compared with medical doctors, veterinarians carry roughly twice as much student loan debt in proportion to their median earnings, according to a 2012 article published in the Journal of Veterinary Medical Education. The earnings comparison included all working veterinarans and medical doctors, not just new graduates.
Applicants-to-seat ratio
“The veterinary college received more than 1,400 applications for its 120 available positions for the doctor of veterinary medicine (DVM) Class of 2018, a 13 percent increase over the previous year” — Virginia-Maryland College of Veterinary Medicine online statement, Aug. 5, 2014.
“The applicants-to-seat ratio for the class of 2018 is estimated at 2.1 to one” — AAVMC news release, Jan. 14, 2014.
Overall, the number of applicants to veterinary colleges has increased during the last decade, from 4,453 in 2003 to 6,732 in 2013, based on data from the AAVMC's Veterinary Medical College Application Service (VMCAS). During that period, the number of available seats also has grown. Counting only seats offered at U.S.-based veterinary colleges, the national applicants-to-seat ratio has ranged from 1.93 to 2.47 since 2003; it was 2.1 in 2013.
Including the international seats taken by U.S. students, the overall applicants-to-seat ratio was roughly 1.64 for the class that enrolled in 2013, according to data presented at the AVMA Economic Summit in October by the AAVMC's Greenhill.
Veterinary colleges are not falsifying the data when they report that the number of applicants exceeds the number of seats by a factor of 10 or more. But such statements do not reflect the applicants-to-seat ratio for veterinary medicine as a whole. Prospective students generally apply to many programs at once. For instance, in 2014, the 6,744 applicants submitted a total of 29,805 applications through VMCAS, a clearinghouse for veterinary school applicants. That’s 4.4 applications per applicant or 6.7 applications per seat (using the recent AAVMC figure of 4,460 U.S. students in domestic and international veterinary colleges in the class of 2018). Nonetheless, the overall applicants-to-seat ratio was 1.64 in 2013.
Number of veterinarians in the U.S. workforce
Number of U.S. veterinarians, 2012: 97,111 — AVMA Market Research Statistics, 2013.
Number of U.S. veterinarians, 2012: 90,705 — 2013 U.S. Veterinary Workforce Study: Modeling Capacity Utilization, April 22, 2013.
Number of U.S. veterinarian jobs, 2012: 70,300 — BLS Occupational Outlook Handbook.
The AVMA website gives the total number of veterinarians in the United States as 99,720 in 2013 and 97,111 in 2012. The organization maintains a database of more than 125,000 people with veterinary degrees. From that total, the AVMA subtracts veterinarians who appear to no longer work in the United States. The estimate includes all people with veterinary degrees who are employed in the United States in private practice, government, industry or academia.
However, in the AVMA’s 2013 study of the veterinary workforce, the organization maintained that the veterinarian count on its website likely overestimated the number of older veterinarians still working. A model developed using data from a survey of veterinarians’ retirement plans and employment status suggested that 90,705 is a more accurate figure for the 2012 total.
Even so, the AVMA continues to publish the higher, unadjusted estimate on its website.
The substantially smaller figure — 70,300 — reported in the Bureau of Labor Statistics (BLS) Occupational Outlook Handbook is derived from national surveys conducted by BLS and the U.S. Census Bureau, sources separate from the internal database from which AVMA derives its estimate. One reason for the difference between the two: The federal figures exclude some individuals with veterinary degrees who have jobs in research, teaching or public health sectors.
Number of veterinarians entering the U.S. workforce
“The number of new graduates from veterinary schools has increased to roughly 3,000 per year” — BLS Occupational Outlook Handbook, 2014-15 edition.
“Number of veterinary grads (2,720) holds steady in 2013” — DVM360 Magazine, Sept. 1, 2013.
“The recent addition of data from our international member institutions suggests that, in 2017, there will be 4,460 graduates who are American citizens from veterinary medical colleges in the U.S. and abroad” — AAVMC online article, September 2014.
By all accounts, the number of veterinarians entering the workforce has been growing at a high rate, well above the 25-year annual average of about 2 percent. But reported numbers of graduating students can vary widely because there are at least three different ways to calculate them.
- Graduates from U.S. colleges of veterinary medicine: Until recently, figures provided by AAVMC included only U.S. colleges of veterinary medicine. By that measure, the number of graduates in the class of 2014 was 3,111.
- U.S. graduates from all accredited veterinary colleges: Starting with the graduating class of 2012, the AAVMC has reported numbers of American students who graduate from accredited veterinary colleges in the United States as well as abroad. Nearly 4,150 veterinary students graduated in 2014.
- North American Veterinary Licensing Exam (NAVLE) data: The number of students who pass the NAVLE gives another way to estimate entrants to the veterinary workforce. Last year, 4,279 students passed the exam. This figure includes graduates of non-accredited and accredited schools as well as veterinarians intending to practice in the United States and Canada.
Due to recent class-size increases, the AAVMC anticipates that the class of 2017 will encompass 3,310 graduates from domestic programs and 1,150 American students who will graduate from U.S.-accredited foreign programs. The AVMA’s latest official projection, announced last October during the organization’s economic summit, is that the number of graduates will plateau after 2017. For this prediction to hold, the recent trend toward class-size increases at U.S. schools would need to stop. In addition, the AVMA would have to deny all future accreditation bids from foreign veterinary programs, reversing another recent trend.
Market for veterinary services
“The problem is a boom in supply (that is, vets) and a decline in demand (namely, veterinary services) …. the total population of pets is going down, along with the sums that owners are willing to spend on the health care of their animals ... ” — New York Times, Feb. 24, 2013.
“In 2011, total expenditures on veterinary visits for dogs were approximately $19.1 billion …. This represented an 18.6 percent increase over 2006 expenditures (3.5 percent compound annual rate)” — U.S. Pet Ownership & Demographics Sourcebook, 2012.
“Revenue per companion animal veterinarian declined 35 percent in real terms from 1991 to 2010" — Dr. Paul Pion, president of the Veterinary Information Network and VIN News Service, in a 2011 speech to the California Veterinary Medical Association.
“Job projections … by government analysts place veterinarians on a list of 30 occupations in America expected to enjoy the highest rate of growth over the decade to 2020 ... The (BLS) projects the number of jobs to reach 83,400 in 2020, an increase of 35.9 percent.” — VIN News Service, Feb. 1, 2012.
Can the market for veterinary services in the United States support the number of veterinarians working today? Since the late 1970s, studies commissioned by veterinary organizations and the federal government have tried to answer this question, as chronicled in 2013 by Dicks in the Journal of the American Veterinary Medical Association.
As the examples above suggest, studies have reported a range of figures that give clues about the trajectory of the market for veterinary services: the number of pets in the United States, the price-sensitivity of pet owners, estimates of total spending on veterinary services and more.
Some of these figures point in opposite directions.
Consistent with the New York Times excerpt above, the AVMA reported a decline in U.S. cat and dog populations from 2006 to 2011, and a 2011 study funded by Bayer Animal Health found veterinary clients increasingly complaining about fees.
Not included in the Times article was a finding in the same 2012 AVMA report that, despite a drop in the pet population, total spending on veterinary services for pets grew between 2006 and 2011, keeping pace with growth in the number of private practice veterinarians in the United States during the same period, even after adjusting for inflation.
Furthermore, a second source of data on the pet population, the American Pet Products Association (APPA) biennial survey, found that pet numbers have not declined in recent years but instead reached an all-time high in 2012, the latest year for which figures are available.
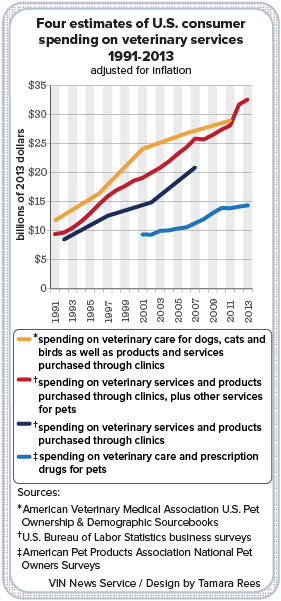 Estimates of consumer spending on veterinary services are available via surveys that periodically are produced by the AVMA, APPA, BLS and Bureau of Economic Analysis, which produces the national income and product accounts, one of the main sources of data on general economic activity in the United States. Market-size estimates from these four agencies differ by many billions of dollars. However, all show long-term growth in overall spending. In terms of inflation-adjusted spending per companion-animal veterinarian, the surveys show either a flat trend (indicating that inflation-adjusted spending is roughly keeping pace with the growth in the number of veterinarians) or a moderate increase.
So how did Pion calculate such a steep decline in real revenue per veterinarian?
He did so by mixing market-size data from different surveys. He took as a starting point a figure from the AVMA survey ($7.2 billion in 1991) and compared that against an endpoint ($14.5 billion in 2010) that he calculated as a rough average of the 2010 APPA survey result ($13.4 billion) and a figure provided by a spokesperson for Banfield Pet Hospital ($16 billion). Problem is, the APPA market size estimates have been consistently much lower than the AVMA estimates, so Pion’s calculation yielded an erroneously small figure for the growth in veterinary services spending. Comparing AVMA data from 1991 with AVMA data from 2011 yields an inflation adjusted-increase in consumer spending of 146 percent — greater than the 112 percent growth in the number of companion animal veterinarians during the same period, according to AVMA data.
Even official government projections of the veterinary economy, developed through a comprehensive review of available information, are subject to wild swings.
Between 2012 and 2014, the BLS dramatically reduced its growth projections for the profession. In the 2012 Occupational Outlook Handbook, the agency projected a 36 percent increase in the number of veterinary jobs over 10 years. In the 2014 edition, the agency lowered that projection to a 12 percent increase in jobs (amounting to 8,400 positions) over a decade, similar to the expected rate of growth in the economy at large.
Sean Martin, the BLS analyst who prepared the most recent effort, said the agency’s projections are based on an analysis of many economic variables — basically the type of data presented in this article as well as additional federal economic and census data — and consultations with experts such as Dicks. Martin worked closely with the AVMA on the latest estimate, he said.
Perhaps unsurprisingly, the baseline growth projections in the AVMA’s 2013 workforce study shows an increase of about 7,500 full-time veterinarians from 2012 to 2022, which is similar to the BLS estimates.
This story has been changed to remove hotlinks to resources that are no longer available.